In previous articles, we looked at taking a CANBus log using BusMaster. Getting useable information from the Logs can be a little bit daunting. In this article, we’ll take a step by step look at converting the BusMaster Log into a Microsoft Excel spreadsheet.
I apologise now if you’re already proficient with Excel, some aren’t, and importing and filtering are not common tasks for all. Hopefully, this step by step guide will help those with less experience with Excel and might be a memory jog for those that need it.
Step 1 – Importing a log file to Excel
Okay, first up open Excel and save your workbook somewhere you can find it again!.
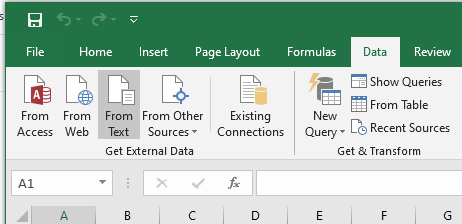
In the workbook, we are going to use the data import feature. This can be found in the ‘Data’ tab of the navigation ribbon. Then we will use the ‘From Text’ function in the ‘Get External Data’ group.
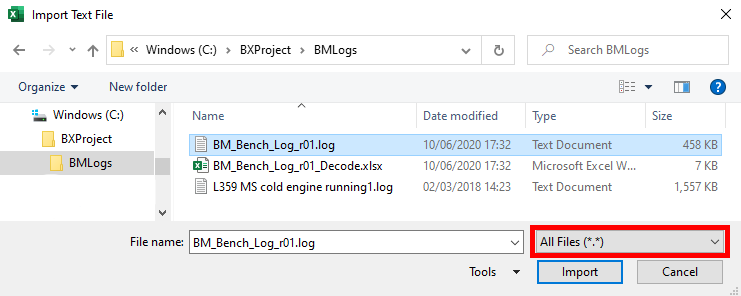
We will then need to tell the ‘Text Import’ tool which files we want to import. Although the BusMaster log file is a simple text file, it used a file type of .LOG. We need to ensure ‘All Files (*.*)’ is selected, as shown, in order to select the log file.
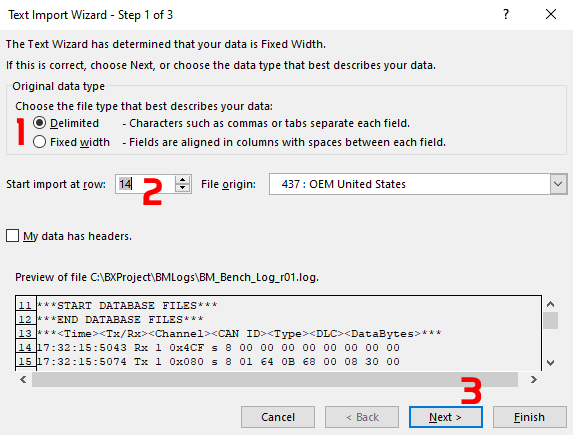
We want to make some changes to the default import options. 1) We want to use ‘Delimited’ import as our log has a space between each recorded field. 2) We want to start importing at row 14 which save a little time tidying up later. 3) Okay, that’s everything for this page, select next.
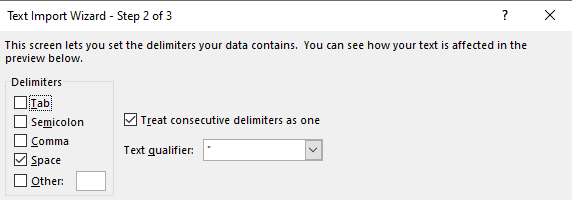
Make sure to select the ‘Space’ delimiter on Step 2 of 3 before selecting ‘Finish’. The default import location is ‘=$A$1’ which is fine for us so we can go ahead and import the data. Hopefully, the log we are importing is only short or this could take a very long time.
It is unusual to need a log of more than 60 seconds for any data review. The slowest messages are sent every 50ms, and the longest chain I have seen is around 40 cycles long, so it takes around 2 seconds on the medium speed bus for all messages to be captured!
Step 2 – Formatting and Filtering the data

Now we have some log data we can start to do some formatting.
- Delete the last two rows from the data file (file end information)
- Insert a row before the first line
- Type in column headers
- Time TX/RX Ch Addr Type Len d0 d1 d2 d3 d4 d5 d6 d7
- Select all populated columns and apply a filter (as shown above)
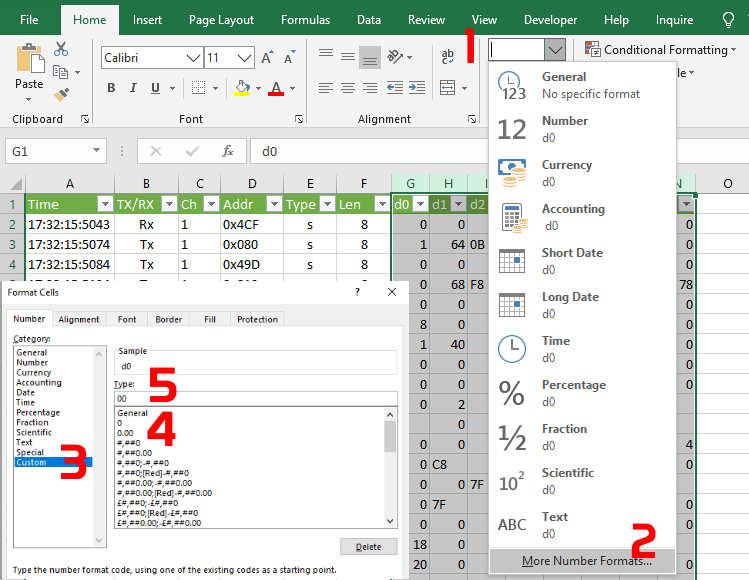
Next, we want to format the data columns to give them a more traditional ‘HEX’ appearance. This simply means we have two characters in each box. To do this we will select a custom format as shown in the steps above.
1) Select the formatting drop down from the ‘Home’ tab.
2) Select more number formats.
3) Select ‘Custom’.
4) Select the ‘0’ pre-defined format
5) Modify the ‘Type’ to show ’00’ (Zero, Zero).

Now we have something we can pretty much work with. Go ahead and filter the order of the data so that we have the received data first.
1) Click the drop-down next to the ‘Tx/Rx’ column title
2) Select ‘sort A to Z’
Have a little scroll up and down and you might see some rows with no data values in, like the box highlighted above. This is another quirk of BusMaster. While it doesn’t seem to lose messages, when comparing against industry-standard software, it does seem to gain some.
This does happen on a vehicle which is why I think there is an issue with BusMaster, but these ghost lines in the data occur far more on bench testing. Perhaps the 120Ohm termination resistor needs to be less. Either way, filtering the ‘Length’ column to only include ‘0’ then deleting all the remain lines will tidy up our log.
Make sure to save regularly between changes. If you import a lot of data, you’ll end up with a very big file which can make Excel unstable and crash.
Hopefully, you are now confident to import and filter your own data!
M
